

Texas Container Demand Study: How Storms, Construction, and Rural Counties Shape the Market
Written on April 27, 2026
by Gabriel B.
In the following categories: Shipping Container Studies
Texas container demand is shaped by three forces that do not exist at the same scale anywhere else in the United States: the highest volume of billion-dollar weather disasters of any state in the country, construction activity that ranks among the most intense nationally, and a rural population of 2.4 million people spread across 181 counties that generates agricultural and property storage demand largely invisible to urban-focused market analysis. This study examines each force, breaks down the Houston and Dallas markets individually, and maps how Texas container demand differs from the national baseline.
Texas by the Numbers: The Market Foundation
Texas is one of the clearest high-volume container states in the country by almost every available measure. The demographic and construction foundation alone — before climate or rural demand is factored in — creates a market that outperforms most states.
Texas — Key Market Indicators
Sources: U.S. Census Bureau QuickFacts 2024, NOAA NCEI Billion-Dollar Disasters, Texas Demographic Center 2023.
The 225,756 building permits issued in Texas in 2024 place it at the top of national construction activity — more than California, Florida, and New York combined in some years. Every active construction project generates job-site storage demand, and the sheer volume of concurrent Texas construction activity creates a base level of commercial container demand that few other states approach. Texas container buyers come from this commercial base first, with residential and agricultural demand layered on top.
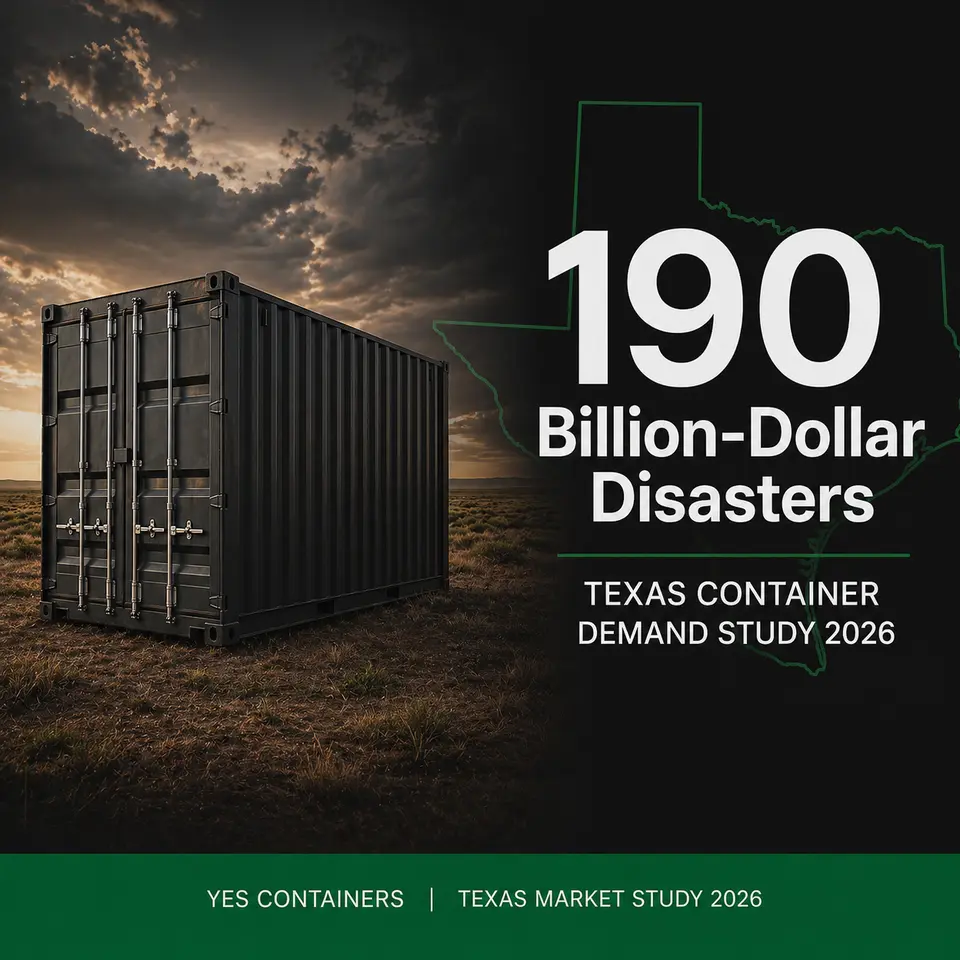
The Climate Factor: 190 Disasters and What They Mean for Container Demand
No state has absorbed more billion-dollar weather and climate disasters than Texas. NOAA's billion-dollar disaster database records 190 qualifying events in Texas since 1980 — hurricanes, flooding, hail, tornadoes, winter storms, and drought events each severe enough to cause at least $1 billion in economic damage. Between 2020 and 2024, Texas averaged 13.6 such events per year.
That disaster frequency creates a distinct category of Texas container demand that does not appear in standard market analysis: emergency and preparedness purchasing. After a major storm or flooding event, containers serve as temporary equipment staging, emergency supply storage, debris management infrastructure, and rapid-deployment shelter for recovery crews. Demand spikes are short-window — typically 30 to 90 days after a qualifying event — but they are recurring and predictable given Texas's disaster history.
Beyond emergency response, persistent climate exposure drives anticipatory purchasing among Texas property owners. Homeowners and businesses in flood-prone coastal counties, tornado corridor areas across North Texas, and hail-exposed regions along the I-35 corridor increasingly purchase containers as permanent storm-preparedness infrastructure — a use case closer to residential storage than emergency response, but triggered by disaster awareness rather than immediate storage need.
Houston: Industrial Scale, Port Adjacency, and Storm Recovery Demand
Houston represents the industrial and logistics anchor of Texas container demand. The city's economic base — petrochemical processing, port operations, energy infrastructure, and construction — generates commercial storage demand at a scale that differs qualitatively from residential market cities. Contractors working the region's extensive pipeline, refinery, and industrial construction projects need job-site storage across wide geographic areas with complex site access conditions.
Port of Houston adjacency adds a distinct layer. Container availability near port facilities is structurally higher than in inland markets, and buyers with logistics operations benefit from proximity to depots that source directly from port inventory. This dynamic makes Houston a stronger market for used 40ft standard containers — the workhorse unit for industrial and logistics applications — than for the new 20ft residential units that dominate markets like Charlotte or Cincinnati.
YES Containers' Houston order data confirms this pattern. Houston generated 8 units and $23,952 in orders during the study period, with used 40ft standard containers the dominant selection — a profile consistent with contractor and commercial buyers rather than residential storage customers. Average order value per unit in Houston was approximately $2,994, reflecting the used condition preference and commercial buyer price sensitivity in this market.
Storm recovery demand from Hurricane Harvey (2017) and subsequent flooding events has also created a recurring replacement and upgrade cycle among Houston-area property owners who experienced storage or equipment loss. Buyers in this segment often prioritize delivery speed and availability over price optimization — a different buying behavior from the planned residential purchase that drives other markets.
Dallas: Construction Growth, Suburban Expansion, and a Different Buyer Profile
Dallas presents a sharply different Texas container demand profile from Houston despite being in the same state. Where Houston is industrial and logistics-driven, Dallas demand is more evenly split between contractor storage and suburban residential use — reflecting the city's role as a fast-growing residential metro rather than a port or energy hub.
| Factor | Houston | Dallas |
|---|---|---|
| Population (2024) | ~2.3M | 1,326,087 |
| Median household income | ~$57,000 | $70,518 |
| Owner-occupied housing rate | ~46% | 42.4% |
| Dominant container use | Industrial, logistics, storm recovery | Construction, suburban residential |
| Preferred container type | Used 40ft standard | New 20ft standard |
| YES Containers AOV/unit | ~$2,994 | ~$3,400 |
| Primary demand driver | Port, energy, disaster recovery | Suburban growth, job-site storage |
Dallas's $70,518 median household income and rapid suburban expansion into the DFW metro fringe create a buyer profile closer to Charlotte or Atlanta than to Houston. Buyers in this market are more likely to be purchasing a new 20ft standard container for a suburban property or a residential job site than the heavy industrial storage units that dominate Houston orders. Dallas container buyers also benefit from strong regional depot coverage that keeps delivery costs lower than in more sparsely covered parts of West Texas.
Rural Texas: 2.4 Million Residents and an Underserved Market
The rural dimension of Texas container demand is the segment most consistently overlooked in market coverage that focuses on Houston and Dallas. Texas's 181 rural counties held 2.4 million people in 2023, according to the Texas Demographic Center — a rural population larger in absolute terms than the total population of many U.S. states.
Rural Texas container demand concentrates around agricultural storage, ranch equipment lockup, hunting property infrastructure, and storm preparedness in areas where construction of permanent outbuildings is expensive, slow, or subject to agricultural zoning constraints. West Texas ranches, Hill Country properties, and South Texas agricultural operations represent recurring buyer profiles that do not appear in metro-focused sales data but are clearly visible in delivery address patterns.
Delivery economics in rural Texas are more complex than in Houston or Dallas. A buyer in a rural county 200 miles from the nearest depot faces meaningfully higher delivery costs than an equivalent buyer in the DFW metroplex — and rural Texas road conditions, property access configurations, and gate dimensions create the full range of delivery complications documented in the container delivery problems study in this series.
Texas Container Demand — Estimated Segment Breakdown
Modeled estimates based on YES Containers order data, NOAA disaster records, Census Bureau construction data, and Texas Demographic Center rural population figures. Not audited national percentages.
El Paso: The Western Texas Market With Its Own Dynamic
El Paso occupies a distinct position in Texas container demand. Located at the far western tip of the state, more than 700 miles from Houston, El Paso's container market is driven more by border commerce, military installation adjacency (Fort Bliss), and cross-border industrial activity than by the storm and construction forces that dominate the rest of Texas. El Paso container buyers tend toward commercial and industrial applications, with used containers preferred for their cost efficiency in a market where appearance is secondary to function.
YES Containers' El Paso order data shows used container preference consistent with commercial and light industrial use — a pattern that distinguishes El Paso from both the residential-leaning Dallas market and the heavy industrial Houston market, confirming that Texas container demand is not a single market but at least three distinct regional markets sharing a state boundary.
Key Findings
- Texas container demand is driven by three overlapping forces not present at equivalent scale in any other state: 190 billion-dollar weather disasters since 1980, 225,756 building permits in 2024, and 2.4 million rural residents across 181 counties.
- Houston demand is industrial and logistics-dominant, with used 40ft standard containers the primary product and commercial buyers averaging approximately $2,994 per unit.
- Dallas demand is more evenly split between contractor storage and suburban residential use, with new 20ft standard containers more common and median household income of $70,518 supporting a more appearance-conscious buyer profile.
- Rural Texas generates significant agricultural and storm-preparedness container demand that is structurally invisible in metro-focused market analysis despite representing 2.4 million potential buyers.
- El Paso functions as a third distinct Texas market driven by border commerce and military adjacency rather than storm exposure or suburban construction growth.
- Storm-preparedness purchasing — anticipatory buying driven by historical disaster frequency rather than immediate storage need — is a Texas-specific demand category that adds a recurring baseline above normal seasonal patterns.
The Florida market study in the Shipping Container Studies series covers the only other state with comparable disaster-driven container demand. To explore containers available in Texas, visit the Texas container page or browse current inventory at the YES Containers product catalog.