

Florida Container Demand Study: How Hurricane History and Growth Shape the Market
Written on April 29, 2026
by Gabriel B.
In the following categories: Shipping Container Studies
Florida container demand is built on a foundation that no other coastal state fully replicates: one of the highest homeownership rates in the Sun Belt, construction activity second only to Texas among southeastern states, and a hurricane and storm exposure record that has shaped how property owners, contractors, and emergency responders think about on-site storage and rapid-deployment infrastructure. This study examines what drives Florida container demand, breaks down the Miami and Tampa markets individually, and maps how storm history, coastal zoning, and demographic patterns create a market that behaves differently from any other state in the country.
Florida by the Numbers: The Market Foundation
Florida's container market foundation is stronger than most states across every measurable indicator — homeownership, construction activity, population growth, and disaster exposure all point in the same direction.
Florida — Key Market Indicators
Sources: U.S. Census Bureau QuickFacts 2024, NOAA NCEI Billion-Dollar Disasters — Florida.
Florida's 67.6% homeownership rate sits above the national average and above Texas, creating a larger residential buyer pool than its coastal, urban character might suggest. Combined with 173,326 building permits in 2024 — the second highest of any state in the southeast — the foundation for both residential and commercial container demand is exceptionally strong before storm exposure is even considered. Florida container buyers enter the market from multiple directions simultaneously: residential storage, active construction, storm preparedness, and post-disaster recovery purchasing all operate in parallel.
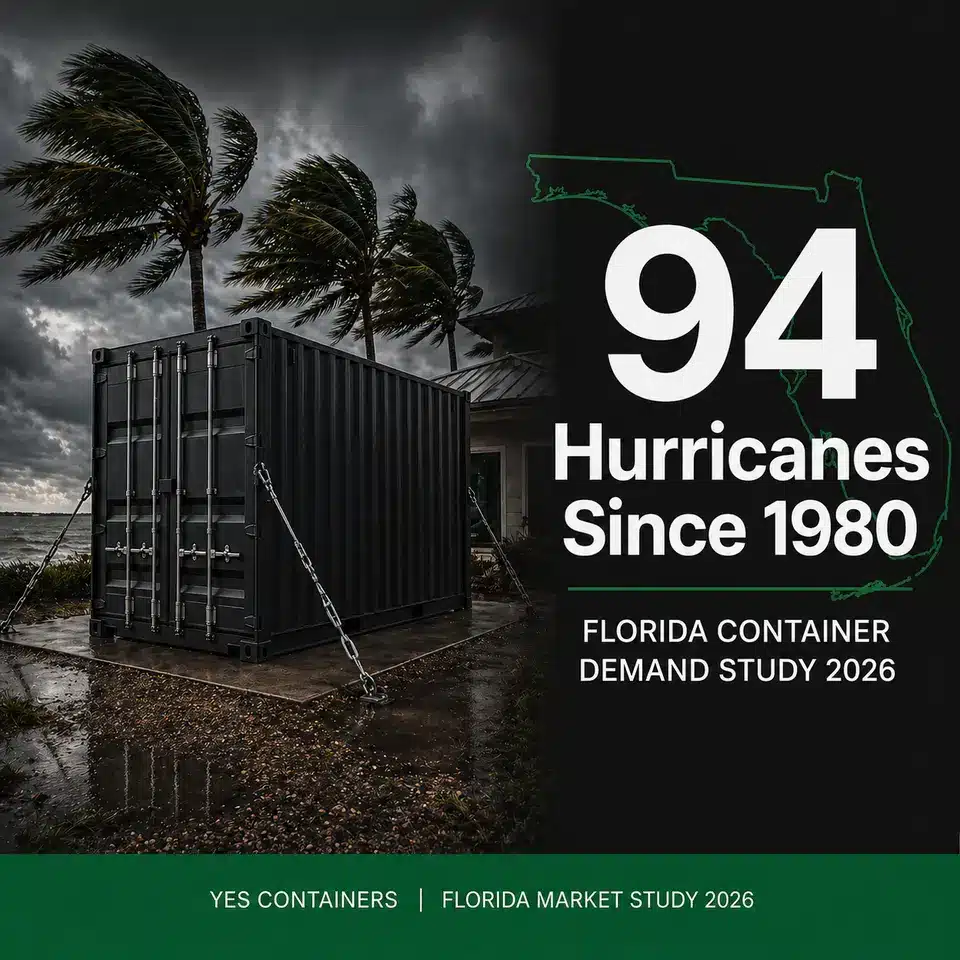
The Hurricane Factor: 94 Disasters and What They Mean for Florida Container Demand
Florida's storm exposure record is second only to Texas in the NOAA billion-dollar disaster database. Since 1980, NOAA records 94 qualifying events affecting Florida — including 36 tropical cyclone events, the most of any state. Between 2020 and 2024, Florida averaged 6.8 billion-dollar events per year.
Hurricane-driven Florida container demand operates across three distinct time phases that together create a more sustained demand pattern than the short-window emergency purchasing that dominates post-storm Texas markets.
Pre-storm preparedness purchasing happens in the weeks before an approaching storm is confirmed. Property owners and businesses secure additional containers to protect equipment, inventory, and valuables that cannot be moved. This demand spike is predictable, calendar-driven by hurricane season (June through November), and concentrated in coastal counties from the Panhandle through South Florida.
Immediate post-storm emergency purchasing follows landfall within 30 to 90 days. Contractors, FEMA-adjacent businesses, debris management firms, and property owners who experienced losses all enter the market simultaneously. Container availability in affected regions compresses during this window, driving buyers to source from depots further from the impact area.
Recovery and rebuild purchasing extends 12 to 36 months after major events. Property owners rebuilding homes and businesses use containers for material storage, temporary site offices, and equipment lockup during extended reconstruction. This phase generates sustained demand that does not appear in emergency-response data but is visible in dealer order patterns in the 18 months following major landfalls.
Tampa: The Residential and Storm-Ready Market
Tampa represents Florida's clearest balanced-growth container market — strong homeownership, meaningful construction activity, and direct hurricane exposure create demand across all three purchase categories simultaneously.
| Indicator | Tampa | Miami | Jacksonville |
|---|---|---|---|
| Population (2024) | 414,547 | ~470,000 | ~975,000 |
| Median household income | $75,475 | ~$47,000 | ~$60,000 |
| Owner-occupied housing rate | 50.3% | ~28% | ~55% |
| Hurricane exposure | High — Gulf coast direct | High — Atlantic and Gulf | Medium — inland buffer |
| Dominant container use | Residential, storm prep, contractor | Commercial, port, industrial | Residential, construction |
| YES Containers orders (study period) | 2 units, $9,810 | 2 units, $9,810 | Strong product page traffic |
Tampa's $75,475 median household income and 50.3% owner-occupancy rate position it as a strong residential container market. Buyers in the Tampa metro are more likely to be homeowners purchasing for backyard storage, remodeling displacement, or storm preparedness than the commercial and industrial buyers who dominate Miami's container demand. Tampa container buyers skew toward new 20ft standard containers for residential applications and used 40ft units for contractor and storm-prep use.
Hurricane Milton's direct strike on the Tampa Bay area in October 2024 created the most significant storm-demand event in the region in decades. The combination of surge flooding, wind damage, and extended power outages drove a wave of storm-recovery container purchasing that extended well into 2025 — a pattern consistent with the 12-to-36-month recovery purchasing cycle documented above.
Miami: Port Activity, Dense Urban Constraints, and a Commercial Buyer Profile
Miami presents a fundamentally different Florida container demand profile from Tampa. With a median household income of approximately $47,000 and an owner-occupancy rate of roughly 28% — among the lowest of any major U.S. metro — Miami's residential container market is structurally limited. Most Miami residents are renters without the land access that residential container placement requires.
What Miami has instead is port activity, dense commercial real estate demand, and a trade and logistics ecosystem that generates consistent commercial container purchasing. Port of Miami handles significant container volume as one of the busiest cruise and cargo ports on the East Coast, and the businesses that service that port — logistics operators, freight handlers, import/export businesses — are recurring container buyers for commercial storage and staging purposes.
Urban placement constraints are more severe in Miami than almost anywhere else in the Florida market. Dense lot coverage, HOA governance across much of the condo-heavy residential stock, and coastal setback rules combine to make residential container placement genuinely difficult in the city core. Miami container demand concentrates in industrial and commercial corridors, suburban fringe areas to the north and west, and post-hurricane recovery applications where placement rules are often temporarily relaxed.
Jacksonville: The Underestimated Florida Market
Jacksonville receives less attention than Miami or Tampa in Florida container market analysis but generates strong organic demand based on its fundamentals. As Florida's largest city by land area and one of its fastest-growing metros, Jacksonville combines a meaningful homeownership base with active construction, military installation adjacency (Naval Station Mayport, Naval Air Station Jacksonville), and lower land costs than South Florida that make container placement more practical.
YES Containers' Jacksonville data shows strong product page traffic during the study period — consistent with an active research audience that has not yet been fully converted by targeted local content. Jacksonville container buyers represent a market opportunity that aligns with the Cincinnati pattern identified in the buyer demographics study: significant organic demand visible in traffic data without corresponding targeted content to capture it.
Coastal Zoning: The Florida-Specific Delivery Constraint
Florida container demand faces a placement and permitting constraint that is more severe than in any other state: coastal zoning regulations. Properties in FEMA-designated flood zones — which cover extensive portions of Florida's coastline, barrier islands, and inland waterway corridors — face restrictions on permanent structure placement that frequently apply to shipping containers when classified as structures rather than personal property.
Flood zone placement rules vary by county and municipality but commonly require containers to be elevated above base flood elevation for permanent placement, or classified as temporary and removed before storm season in particularly sensitive zones. Insurance requirements in coastal counties add a further layer — some carriers will not insure contents in a container placed in a flood zone regardless of the container's structural rating.
These constraints do not eliminate Florida container demand — they redirect it. Buyers in coastal zones who cannot place a container permanently often rent for the duration of a renovation or construction project, then remove it. Buyers further inland who are outside strict flood zones place containers permanently and use them for the full range of residential, agricultural, and commercial applications visible in other Sun Belt states.
Florida Container Demand — Estimated Segment Breakdown
Modeled estimates based on YES Containers order data, NOAA disaster records, and U.S. Census Bureau data. Not audited figures.
Key Findings
- Florida container demand is shaped by 94 billion-dollar disasters since 1980 — including 36 tropical cyclone events — creating a three-phase storm-driven demand cycle of preparedness, emergency, and recovery purchasing that sustains demand year-round.
- Florida's 67.6% homeownership rate and 173,326 building permits in 2024 provide a strong residential and commercial demand foundation independent of storm exposure.
- Tampa is Florida's most balanced container market: $75,475 median income, 50.3% homeownership, and direct Gulf Coast hurricane exposure create simultaneous residential, contractor, and storm-prep demand.
- Miami's ~28% owner-occupancy rate limits residential container demand sharply — the city's market concentrates in commercial, port-adjacent, and industrial applications rather than backyard storage.
- Jacksonville is an underserved Florida container market with strong organic search demand but limited targeted local content — the same content gap pattern visible in Cincinnati and Columbus in other regional studies.
- Coastal zoning regulations redirect rather than eliminate Florida container demand — placing it in suburban and inland corridors while concentrating temporary and commercial use in flood-zone-adjacent areas.
- Storm-preparedness purchasing accounts for an estimated 20% of Florida container demand — a category that does not exist at comparable scale in any non-Gulf or Atlantic coastal state.
The Texas container demand study in this series covers the only other state with comparable disaster-driven purchasing behavior. For containers available across Florida, visit the Florida container page or browse specific metro inventory for Tampa, Miami, and Jacksonville. Current pricing and availability across all container types is listed in the YES Containers product catalog.